Mantex

Tutorials, Study Guides & More

  • HOME
  • REVIEWS
  • TUTORIALS
  • HOW-TO
  • CONTACT
>> Home / Archives for Numbers

Numbers in essays

August 24, 2009 by Roy Johnson

sample from HTML program and PDF book

1. A general rule for the presentation of numbers (excluding those dealing with science and mathematics) is that numbers below a hundred are written, and numbers above one hundred are presented by digits:

four brown horses ten years old
she is twenty-two 3,500 tonnes of coal
286 casualties 200 metres long

2. Notice that numbers expressed in more than a single word are hyphenated:

thirty-six     ninety-eight     fifty-five

3. Even above one hundred, round numbers are often expressed as words:

one thousand     two million     three billion

4. However, very large numbers are often expressed in a combination of figures and units of millions or billions:

Social benefit payments were running at $7.8 million per day compared with only $5.6 million a year ago.

5. Where two different series of quantities are being discussed, it may clarify matters if words are used for one series and numbers for the other:

Ten wards in the county emergency hospital contained 16 beds each, but fifteen others contained as many as 30.

6. The following example taken from a piece of journalism illustrates this general rule with mention of numbers both below and above one hundred.

One of the nuclear weapons systems would be a four-boat Trident strategic missile fleet with 512 warheads compared with the 192 urged by Labour and the Liberal Democrats to match the numbers in the Polaris fleet it replaces.

7. Do not begin sentences with a numeral (such as 46 or 107). Either rearrange the sentence, or write out the number (as Forty-six or One hundred and seven).

8. Decimals and percentages should be expressed in figures, and the word ‘percent’ should be written out, except in scientific writing:

With interest currently running at 8 percent, the total monthly repayment figure would be almost $2.5 million.

9. When expressing dates before the Christian era, remember to put the numbers of the earlier date first, and give the later date in full to avoid confusion:

Nebuchadnezzar (1792-1750 BC) not Nebuchadnezzar (1792-50 BC)

10. Dates after the Christian era should be expressed in the same way, but with the era written first:

Nebuchadnezzar (1792-1750 BC) but Pope Sixtus III (AD 432-440)

11. The use of Roman numerals is normally confined to the names of monarchs and popes, for the acts of plays, and for the volumes and subdivisions of books:

Edward VI Pope Pius IV
Othello III.iv.18 Chapter XII
Part III Act V, Sc 3

12. In numbers above a thousand or more, the thousands are marked off with a comma:

10,000 BC     1,500 metres

13. Notice that the plurals of numbers are formed by the addition of s alone. The apostrophe is not required:

in the 1920s     pilots of 747s

© Roy Johnson 2003

Buy Writing Essays — eBook in PDF format
Buy Writing Essays 3.0 — eBook in HTML format


More on writing essays
More on How-To
More on writing skills

Filed Under: Writing Essays Tagged With: Academic writing, Essays, Numbers, Reports, Study skills, Term papers, Writing skills

Numbers, Tables, and Charts

May 24, 2009 by Roy Johnson

practical guidance on the visual presentation of data

Have you ever seen a document containing numbers, tables, and charts – and been unable to understand the information being displayed. Of course you have; and the fault is not yours. The data has simply not been presented effectively. This book deals with the data presentation skills required to show numbers, tables, and graphs in documents and presentations. Many people assemble their data honestly enough when writing reports and giving presentations, but they often do so without thinking how incomprehensible it might be to the audience.

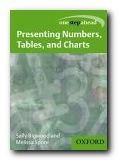
Numbers, Tables, and ChartsOxford University Press have just brought out a series of beginner’s manuals on communication skills. The emphasis is on no-nonsense advice directly related to everyday life. The authors show you how to present numerical data to make its outcomes more self-evident and more easily digestible. This is done by putting figures into a logical order, adding focus to the data, and using layout to guide the reader’s eye towards what is significant.

They cover how to design tables. It’s amazing how much clearer these can be made by removing unnecessary grid lines, aligning numbers and column headings, creating clear titles and headings, and removing any ‘chart junk’.

Graphs should be uncluttered, simple, non-misleading in terms of scale and numbers, and used to illustrate a clear message.

They show how to construct graphs and bar charts so that they immediately reveal the significance of the data they contain. There are also examples of when to use pie charts, scattergrams, and pictographs (small icons)

There’s also useful writing skills advice on how to integrate numbers and statistics into the text of documents. For instance, don’t start sentences with figures or digits, and how to mix the use of words and digits to clarify meaning, as in nine 6-inch rulers and three 5-a-side football matches.

Most presentation of data is these days done using office software packages, so it’s good that they give this a mention, with tips for creating good handouts.

They finish with a case study which tracks the raw data of some school exam results from gathering to final presentation. The grades and numbers can be presented in different ways, and the head teacher must choose the best way for a meeting with the governors.

The chapters of this book are short, but almost every page is rich in hints and tips. The strength of this approach is that it avoids the encyclopedic volume of advice which in some manuals can be quite frightening. This is a book which will reassure those who need it.

The all-time star in this field is Edward Tufte, on whose work they draw substantially. I was glad to see him listed in the bibliography. This is a cheap and cheerful version of the same layout principles he promotes in his beautifully designed books.

© Roy Johnson 2003

Numbers, Tables, and Charts   Buy the book at Amazon UK

Numbers, Tables, and Charts   Buy the book at Amazon US


Sally Bigwood and Melissa Spore, Presenting Numbers, Tables, and Charts, Oxford: Oxford University Press, 2003, pp.144, ISBN: 0198607229


More on information design
More on design
More on media
More on web design


Filed Under: Information Design, Study skills Tagged With: Charts, Communication, Data presentation, Information design, Numbers, Presenting information, Tables, Writing skills

Get in touch

info@mantex.co.uk

Content © Mantex 2016
  • About Us
  • Advertising
  • Clients
  • Contact
  • FAQ
  • Links
  • Services
  • Reviews
  • Sitemap
  • T & C’s
  • Testimonials
  • Privacy

Copyright © 2025 · Mantex

Copyright © 2025 · News Pro Theme on Genesis Framework · WordPress · Log in