Mantex

Tutorials, Study Guides & More

  • HOME
  • REVIEWS
  • TUTORIALS
  • HOW-TO
  • CONTACT
>> Home / Archives for Displaying information

Envisioning Information

July 20, 2009 by Roy Johnson

best-selling illustrated essays on presenting information

Over the last twenty years, Edward Tufte has published three impressive volumes setting forth his ideas on information design. The first, The Visual Display of Quantitative Information was designated as ‘pictures of numbers’ and dealt with statistical charts, graphs, and tables. This second volume deals with ‘pictures of nouns’, which is his metaphorical way of describing the ‘strategies for high-dimensional data, and how to increase information depth on paper and computer’.

To envisage information…is to work at the intersection of image, word, number, art
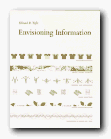
Envisioning InformationHe makes a persuasive case for layering, colour, and separation as a means of clarifying information when it is rendered in two dimensions – principally on the printed page. What he calls an ‘escape from flatland’ is illustrated in a series of wonderfully complex diagrams: a Javanese railway timetable shows departures and arrivals, distance, altitude, and even facilities at each station.

He explores the interesting notion that in a world of marks on paper, good presentation is affected by the rule that ‘1 + 1 = 3 or more’. That is, even two simple lines become three visual units because of the space between them – and he provides plenty of information to prove his case, illustrated with such diverse materials as old maps, musical notation, and even medical records.

His argument that small multiple images are the best way to reveal differences is beautifully illuminated by photographs of Chinese calligraphy and nineteenth century engravings of fly fishing lures, but it doesn’t seem altogether convincing – and as in the other volumes of this trilogy, some of the bad examples are just as visually attractive as the good – which appears to spoil the point he’s trying to make.

He’s much more persuasive on the use of colour to impart information, although at some points, even if the prints and engravings are stunning, the reading is not easy:

Transparent and effective deployment of redundant signals requires, first, the need – an ambiguity or confusion in seeing data display that can in fact be diminished by multiplicity – and, second, the appropriate choice of design technique (from among all the various methods of signal reinforcement) that will work to minimize the ambiguity of reading.

For somebody who claims to be aiming for clarity in communication, this reads like a bad example out of a writer’s style manual.

He keeps coming back, as do many other theorists of two-dimensional spatial design, to one of the most interesting challenges of all – the notation of dance. Cue eighteenth-century engravings of dancing masters with fancy hats and weird hieroglyphics trailing out of their feet. Other examples in the book range from flight schedules from Czech airways to Japanese railway timetables, rowing contests, and even a diagram of Wagner’s operas.

If we want to take a robust line on someone who is obviously very successful, it’s possible to argue that Tufte designs more successfully than he writes. Much of the time, his text reads as if it has been badly translated from German; yet if ever he issues his books in paperback, they are so attractive he’ll be able to retire on the proceeds.

© Roy Johnson 2002

Envisioning Information   Buy the book at Amazon UK

Envisioning Information   Buy the book at Amazon US


Edward Tufte, Envisioning Information, Cheshire, CT: Graphics Press, 1990, pp.126, ISBN: 0961392118


More on information design
More on technology
More on digital media

Filed Under: Graphic design, Information Design Tagged With: Displaying information, Edward Tufte, Envisioning Information, Graphic design, Information design

The Visual Display of Information

July 20, 2009 by Roy Johnson

best-selling illustrated essays on presenting information

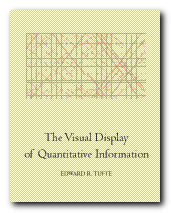
The Visual Display of Information is the earliest of the three books on information design which Edward Tufte has written, designed, and published himself. In it he develops his theory of “a language for discussing graphics and a practical theory of data graphics” The first chapter plots the rise of data maps, which he claims didn’t really develop properly until the late seventeenth century, and then took off in the nineteenth – from which he gives some very elegantly illustrated examples. The centrepiece of this section is Charles Joseph Minard’s time chart of Napoleon’s retreat from Moscow. This shows in a really interesting manner the devastating reduction in the size of the army plotted again geographic location and ambient temparature. It is a fascinating mixure of three levels of information rendered as a graphical image.

Graphical excellence is the well-designed presentation of interesting data – a matter of substance, of statistics, and of design.

The Visual Display of InformationI was surprised to find how his writing is even more compacted and elliptical than in a book such as Visual Explanations written nearly twenty years later. Here he writes of a map “achieving statistical graphicacy, even approaching the bivariate scatterplot”. You’ve got to be prepared to hack your way through a lot of this sort of thing.

In a discussion of the integrity of graphical data and statistics that lie he gives examples from Britain’s national debt during the war of American Independence – which show graphs going up whilst the truth goes down. This is very convincing – though I couldn’t easily get used to his habit of referring to ‘data’ in the plural.

He has the interesting notion that ‘data-ink’ ought to be minimised. In other words, any information will stand out more clearly the less printing is done to present it.: “The number of information-carrying dimensions depicted should not exceed the number of dimensions in the data”. You’ve got to be prepared to leap from traffic deaths and government expenditure to the properties of chemical elements, and be prepared for lots of detail on the difference between boxplots, bar charts, histograms, and scatterplots.

He’s basically in favour of simplifying representation – reducing what he calls ‘chart-junk’. That is, anything which does not contribute to revealing information. Yet there remain strange contradictions. One of his edicts (which seems sensible) is that “Graphics can be shrunk way down – Many data graphics can be reduced in area to half their currently published size with virtually no loss in legibility and information.” Yet he often presents examples of bad (but visually attractive) graphics across double page spreads. And he’s not bashful. When it comes to naming one of his own designs (a list of voting patterns in the 1980 US elections) it becomes not a mere list but a ‘SUPERtable’.

But this is a stimulating and attractive production. I was surprised that there wasn’t a formal bibliography, but he chooses to foreground his references directly into the generous page margins as a design feature. He developed a graphic style for this book which he has stuck to ever since. The basic formula is beautiful illustrations, some occupying a whole page, with the relevant text condensed in a crisp and economic style. No topic exceeds a double page spread, and the book is produced from very high quality paper, printed like a work of art, and bound as if it were a rare first edition.

© Roy Johnson 2002

The Visual Display of Information   Buy the book at Amazon UK

The Visual Display of Information   Buy the book at Amazon US


Edward Tufte, The Visual Display of Quantitative Information, Cheshire, CT: Graphics Press, 1997, pp.156, ISBN: 0961392126


More on information design
More on technology
More on digital media

Filed Under: Graphic design, Information Design Tagged With: Displaying information, Edward Tufte, Graphic design, Information design, The Visual Display of Information

Visual Explanations

July 20, 2009 by Roy Johnson

best-selling illustrated essays on presenting information

Visual Explanations is Edward Tufte’s passionate manifesto for intelligent information design. He is concerned with the need for scale, accuracy, and truthful proportion in the visualisation of data. The book derives much of its charm from the beautiful reproduction of its illustrative materials. He includes engravings, photographs, maps, computer-generated images, and even built-in flaps showing motion and before-after effects. The diversity of his examples is just as impressive.

Clarity and excellence in thinking is very much like clarity and excellence in the display of data. When principles of design replicate principles of thought, the act of arranging information becomes an act of insight.

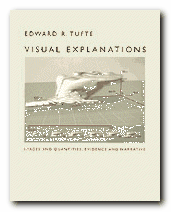
Visual ExplanationsThey are drawn from scientific papers, conjurors’ manuals, and even books designed to be read under water. In one stunning example, he uses video snapshots of his own two-dimensional yet dynamic visualisation of a thunderstorm. Tufte [pronounced “TUFF-tee”] makes his central argument in a chapter which has now become famous.

This discusses the mis-representation of data related to the 1986 Challenger space shuttle which resulted in a disastrous explosion and the death of all the cosmonauts on board. His dense technical analysis of data-presentation and bad practice is used to argue that the fatal accident could have been averted if charts and diagrams had been presented more intelligently, more accurately.

A chapter on conjuring tricks focuses on the clever representation of temporal progression in single illustrations from how-to-do-it books. However, it has to be said that sometimes it’s not quite clear what point he’s making, and he seems to be struggling with what is obvious: that it’s difficult to represent fluid motion in static, two-dimensional images.

Eventually it emerges that he wishes to compare magic with it’s opposite – teaching. One amazes by concealment, the other should inform by revelation. “Your audience should know beforehand what you’re going to do.” That’s a useful insight for some of us.

His attitude is enormously confident and persuasive. Yet if you can brace yourself as a reader, it sometimes seems that he doesn’t always follow his own theories in the presentation of materials – and this in a book which he wrote, designed, and published himself. On some pages, it’s difficult to link illustration to argument; some reproductions are disproportionately large for the point they are making; and he pursues the odd habit of crowding the generous page margins with bibliographic minutiae which would normally be reserved for chapter endnotes.

He writes in a cryptic, elliptical manner, and is much given to compressed generalisations and gnomic claims such as “to make verbs visible, is at the heart of information design” – though this approach can also be quite witty, as when he dismisses one of the bad examples as “better than nothing ([but] that’s all it’s better than”.

Despite these occasional oddities, there are thought-provoking ideas on almost every page. For instance, the idea that the public health warnings on US billboard cigarette advertisements are less effective because they are difficult to read, crammed as they are into boxed text, sans-serif fonts, in continuous capitals, and underlined – which makes four typographical solecisms in one.

SURGEON GENERAL’S WARNING: SMOKING CAUSES LUNG CANCER, HEART DISEASE, EMPHYSEMA, AND MAY COMPLICATE PREGNANCY.

Despite the graphic variety of his presentations, many of his arguments are amazingly orchestrated onto single or double-page spreads, and the book is an almost irresistibly beautiful production. What he’s actually talking about is visual rhetoric: “by establishing a structure of rhythm and relationships, [graphic] parallelism becomes the poetry of visual information”. We might wish to query some of his theoretical claims, but it’s very hard to be critically detached from such a seductive presentation of evidence – which paradoxically is the very point he’s warning us about.

© Roy Johnson 2002

Visual Explanations   Buy the book at Amazon UK

Visual Explanations   Buy the book at Amazon US


Edward Tufte, Visual Explanations, Cheshire, CT: Graphics Press, 1997, pp.156, ISBN: 0961392126


More on information design
More on technology
More on digital media


Filed Under: Graphic design, Information Design Tagged With: Displaying information, Edward Tufte, Graphic design, Information design

Get in touch

info@mantex.co.uk

Content © Mantex 2016
  • About Us
  • Advertising
  • Clients
  • Contact
  • FAQ
  • Links
  • Services
  • Reviews
  • Sitemap
  • T & C’s
  • Testimonials
  • Privacy

Copyright © 2025 · Mantex

Copyright © 2025 · News Pro Theme on Genesis Framework · WordPress · Log in