gathering, analysing, and presenting data
Many subjects such as psychology and biology have a ‘hidden’ requirement of using statistics which gives many students problems when they realise that they’ve got to tackle them as part of the course. As Gordon Rugg observes in this guide for beginners: ” Many people emerge from their first encounter with stats feeling distinctly bruised, and with a mental image of stats as a bizarre set of meaningless rituals that you have to follow because you’re told to.”
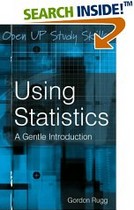 What he’s offering is a sympathetic guide to the basic principles without terrorizing readers with a lot of abstract mathematics and complex equations. It’s intended to provide an overview of statistics, and to explain how statistics fit into the big picture of research, with particular attention to using statistics as a coherent part of research design. He brings off this intention very well by using a simple but clever device: he makes his explanations amusing, with concrete examples all the way.
So concepts such as mean, average, and standard deviation are explained using problems from everyday life, and he also explains why some of the basic statistical methods are necessary for the sake of scientific accuracy. It’s not enough to say that 50% of a sample was positive if you’ve only chosen two or three items to test, for instance.
He goes into measurement theory, showing the variety of ways in which things can be enumerated or calibrated – which is particularly useful for people designing surveys and questionnaires.
He also explains the difference between reliability and validity in statistics, using the example of ‘descriptions of Father Christmas’. These would be very reliable, because everyone will describe him in the same way; but they have zero validity, because he doesn’t actually exist.
There’s an explanation of how data can best be presented using graphs, pie-charts, and scatter diagrams – as well as the ways in which they are commonly misused.
The latter parts of the book, which deal with the presentation of knowledge – patterns, categorization, and probability theory – come almost into the realms of philosophy.
So – the first part of the book deals with measuring and presenting data accurately. This then leads to the more interesting issues of interpretation and knowing what questions can be legitimately asked when trying to assess the significance of any findings – what he calls the ‘So what?’ question.
For this, statistical tests are required. He talks you through how to choose the right type and only goes into maths and calculations when absolutely necessary. All of this is done humanely, by making his primary illustrative examples such things as a game of tiddlywinks and the height at which gorillas sleep in trees.
This is followed by even more improbable examples of limpet racing to illustrate what’s called ‘Parametric Statistics’, and he ends with some useful comments on the latest statistical software which is used for neural networks, data mining, and genetic algorithms.
I’m rather glad that my subject (literary studies) has not yet been invaded by ‘scientific’ theoretical approaches which involve statistics, but for anybody who can’t avoid the subject, this is a very enjoyable introduction.
© Roy Johnson 2007
![]() Buy the book at Amazon UK
Buy the book at Amazon UK
![]() Buy the book at Amazon US
Buy the book at Amazon US
Gordon Rugg, Using Statistics: a gentle introduction, Open University Press: Maidenhead, 2007, pp.137, ISBN: 0335222188
More on study skills
More on writing skills
More on online learning
 Doing Your Research Project: A Guide for First-Time Researchers in Education and Social Science is a best-selling UK guide which covers planning and record-keeping, interviewing, reviewing ‘the literature’, questionnaires, and writing the final report. Even if you are studying a subject other than education or social science, this is a wonderfully helpful guide on organising your ideas and your writing at research level. It’s a model of clarity and good sense. Now in its third edition – and deservedly so. Highly recommended.
 Writing your Doctoral Dissertation: Invisible Rules for Success is a US guide to writing at post-graduate level which uses practical examples, is strong on planning, and offers advice on negotiating the process of research – from making an application to submitting a dissertation. It’s also good on the issue of selecting a research topic and developing it into a feasible project. One of the features which has made this a popular choice is that it offers tips from former students on the problems they have faced in doing research – and how they have overcome them.
 If you have any serious intention of preparing text for publication, then Copy-Editing: The Cambridge Handbook for Editors, Authors and Publishers is your encyclopedia on typography, style, and presentation. It has become the classic UK guide and major source of reference for all aspects of editing and text-presentation, covering every possible bibliographic detail. It also covers a wide range of subjects – from languages to mathematics and music – as well as offering tips on copyright and preparing text for electronic publication.
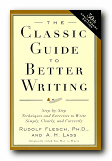 The Classic Guide to Better Writing is more-or-less what its title suggests. It’s a best-selling US guide with emphasis on how to generate, plan, and structure your ideas. It also covers basic grammar, good style, and common mistakes. The approach is step-by-step explanations on each topic, plenty of good advice on how to avoid common mistakes, and tips on how to gain a reader’s attention. Suitable for all types of writing, it well deserves its good reputation.
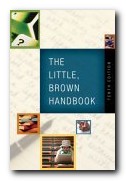 If you need just one book which will answer all your questions on writing – from punctuation to publication – then this is it. The Little, Brown Handbook is an encyclopaedic US guide to all aspects of writing. It includes vocabulary, punctuation, grammar, style, document design, MLA conventions, editing, bibliography, and the Internet. All topics are profusely illustrated and cross-indexed, and some of the longer entries are virtually short essays. It also has self-assessment exercises so that you can check that you have understood the contents of each chapter. The Swiss army penknife of writing guides. Highly recommended.
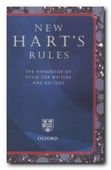 Hart’s Rules for Compositors and Readers at the University Press Oxford This is a UK classic guide to the finer points of editing and print preparation, spelling and typography. It was first written as the style guide for OUP, but quickly established a reputation well beyond. There’s no hand-holding here. Everything is pared to the bone. the centre of the book deals with ‘difficult’ and irregular spellings. A masterpiece of compression, it is now in its thirty-ninth edition. This is one for professionals rather than student writers.
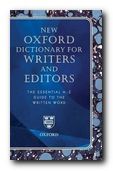 The Oxford Dictionary for Writers & Editors . This is a specialist dictionary for writers, journalists, and text-editors. Unlike most dictionaries, it does not offer explanations of the words meanings. It deals with problematic English and foreign words, offering correct spellings and consistent usage in the OUP house style. By concentrating on difficult cases, it saves you a lot of time. The latest edition also includes American spellings. Strongly recommended.
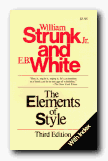 The Elements of Style. This is an old favourite – a ‘bare bones’ guidance manual which cuts out everything except the essential answers to the most common writing problems. It covers the elements of good usage, how to write clearly, commonly misued words and expressions, and advice on good style. The emergency first-aid kit of writing guides. It’s very popular, not least because it’s amazingly cheap. Suitable for beginners. There’s an online version available if you do a search – but the cost of a printed version will pay dividends.
 A Manual for Writers of Term Papers, Theses, and Dissertations. This is a modern American classic guidance manual for academic writing. It covers everything from abbreviations and numbers to referencing and page layout. It also includes sections showing how to lay out tables and statistics; lots on bibliographic referencing; and how to deal with public and government documents. The latest edition also includes advice on word-processing.
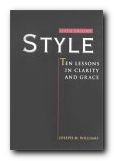 Style: Ten Lessons in Clarity and Grace. This is a popular guide – particularly amongst creative writing enthusiasts. It offers advice for improving your writing – by putting its emphasis on editing for clarity, creating structure, and keeping the audience in mind. These lessons are useful for all types of writing however. It has plenty of illustrative examples and exercises, an appendix with advice on punctuation, and a good glossary. Recommended.
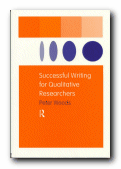 Successful Writing for Qualitative Researchers. This is one for specialist academic writing at post-graduate level. It covers all the stages of creating a scholarly piece of work – from the preparation of a project through to the completion and possible publication of the finished article. Includes sections on style, editing, and collaborative writing. It takes a positive and encouraging tone – which will be welcome to those embarking on such tasks for the first time.
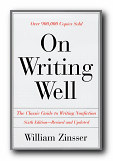 On Writing Well. This is a best-selling title, now in its sixth edition. It offers reassuring guidance from an experienced journalist on writing more effectively in a number of genres. He covers interviews, travel writing, memoirs, sport, humour, science and technology, and business writing. The approach is to take a passage and analyse it, showing how and why it works, or where it might be improved. It is particularly good on editing and re-writing.