Mantex

Tutorials, Study Guides & More

  • HOME
  • REVIEWS
  • TUTORIALS
  • HOW-TO
  • CONTACT
>> Home / Archives for Information design

Numbers, Tables, and Charts

May 24, 2009 by Roy Johnson

practical guidance on the visual presentation of data

Have you ever seen a document containing numbers, tables, and charts – and been unable to understand the information being displayed. Of course you have; and the fault is not yours. The data has simply not been presented effectively. This book deals with the data presentation skills required to show numbers, tables, and graphs in documents and presentations. Many people assemble their data honestly enough when writing reports and giving presentations, but they often do so without thinking how incomprehensible it might be to the audience.

Numbers, Tables, and ChartsOxford University Press have just brought out a series of beginner’s manuals on communication skills. The emphasis is on no-nonsense advice directly related to everyday life. The authors show you how to present numerical data to make its outcomes more self-evident and more easily digestible. This is done by putting figures into a logical order, adding focus to the data, and using layout to guide the reader’s eye towards what is significant.

They cover how to design tables. It’s amazing how much clearer these can be made by removing unnecessary grid lines, aligning numbers and column headings, creating clear titles and headings, and removing any ‘chart junk’.

Graphs should be uncluttered, simple, non-misleading in terms of scale and numbers, and used to illustrate a clear message.

They show how to construct graphs and bar charts so that they immediately reveal the significance of the data they contain. There are also examples of when to use pie charts, scattergrams, and pictographs (small icons)

There’s also useful writing skills advice on how to integrate numbers and statistics into the text of documents. For instance, don’t start sentences with figures or digits, and how to mix the use of words and digits to clarify meaning, as in nine 6-inch rulers and three 5-a-side football matches.

Most presentation of data is these days done using office software packages, so it’s good that they give this a mention, with tips for creating good handouts.

They finish with a case study which tracks the raw data of some school exam results from gathering to final presentation. The grades and numbers can be presented in different ways, and the head teacher must choose the best way for a meeting with the governors.

The chapters of this book are short, but almost every page is rich in hints and tips. The strength of this approach is that it avoids the encyclopedic volume of advice which in some manuals can be quite frightening. This is a book which will reassure those who need it.

The all-time star in this field is Edward Tufte, on whose work they draw substantially. I was glad to see him listed in the bibliography. This is a cheap and cheerful version of the same layout principles he promotes in his beautifully designed books.

© Roy Johnson 2003

Numbers, Tables, and Charts   Buy the book at Amazon UK

Numbers, Tables, and Charts   Buy the book at Amazon US


Sally Bigwood and Melissa Spore, Presenting Numbers, Tables, and Charts, Oxford: Oxford University Press, 2003, pp.144, ISBN: 0198607229


More on information design
More on design
More on media
More on web design


Filed Under: Information Design, Study skills Tagged With: Charts, Communication, Data presentation, Information design, Numbers, Presenting information, Tables, Writing skills

Open Here: instructional design

July 24, 2009 by Roy Johnson

illustrated and amusing instruction design graphics

Have you ever tried to erect a wardrobe from the instructions in a self-assembly pack? Or followed the printed notes for programming your VCR? Open Here presents an entertaining collection of diagrams, graphics, and visual instructions for tackling the problems of everyday life which baffle us all. It includes such tricky examples as how to tie a bow tie whilst looking in a mirror, and what instructions to give people for the emergency evacuation of an aeroplane.

Open Here: instructional designMijksenaar and Westendorp achieve much of their effect from the vibrant colour reproductions of instructional design with which the book is packed. Every page is a visual treat. The examples they give are so wide-ranging that I often wished they had stayed longer on any one, providing a more extended analysis, rather than flitting so swiftly onto the next after a few comments.

There’s also an interesting historical overview which shows the presentation of instructions going from realistic photos or drawings of whole objects in the nineteenth century, to more recent depictions which tend to focus on specific parts or functions.

However, applying the principles they espouse to the book itself reveals a weakness as far as the serious sector of their potential market is concerned. Some pictures have explanatory captions, whilst others do not; and on the whole, rather too much space is devoted to visuals and too little to their textual commentary, which for the most part is tantalisingly cryptic.

In addition, they don’t always make a clear distinction between the good and bad examples, and I was disappointed that they didn’t provide a bibliography, because the book is obviously based on a lot of research. They also make little distinction between simple diagrams produced for the lay user and those expanded technical illustrations of cross-sections through a car engine which are produced for engineers. But then, this variety adds to the book’s visual appeal. I was yearning for more analysis, but read it with a permanent smile on my face.

This is a lively and refreshing publication which will make anyone reading it intensely conscious of instructional design. The text suggests that their examples are drawn from an archive of materials which has been built up over thirty years, so I hope that their next publication provides a more extended analysis using similar examples, but without sacrificing any of the graphic zest which makes this book so attractive.

© Roy Johnson 2000

Open Here   Buy the book at Amazon UK
Open Here   Buy the book at Amazon US


Paul Mijksenaar and Piet Westendorp, Open Here: the art of instructional design, New York: Joost Elffers Books, 1999, pp.144, ISBN: 1556709625


More on web design
More on technology
More on digital media
More on study skills
More on information design


Filed Under: Graphic design Tagged With: Graphic design, Information design, instructional design, Open Here

Practical Information Policies

July 13, 2009 by Roy Johnson

data management and information architecture

This is a study of information architecture and management – both in theory and practice. It is written with three groups of readers in mind – managers in libraries and information services; business managers and executives; and students of information science, librarianship, and information management. Elizabeth Orna starts Practical Information Policies by explaining why organizations need policies and strategies for managing information – outlining the benefits of having a policy, and the losses of not having one. She offers interesting definitions of the basic concepts she discusses, such as ‘information policy’, ‘knowledge management’, and ‘information management’.

Practical Information PoliciesWhen she moves on to look at how institutions are organized, she presents a very useful checklist of questions. These can be posed to query the efficiency of management systems. For instance, ‘What provision does the organization make for job handover and transfer of knowledge?’ These sorts of questions will be very useful to those people serious about systems analysis, just as they will strike fear into slack managers facing a quality assurance inspection.

These considerations form the basis for the next part of her study, which deals with making an information audit, then interpreting and presenting its findings. She sees individuals as repositories of skills and knowledge, and her basic argument is that they are both the prime asset of an organization and the agents for successfully managing change. The examples she discusses are drawn from real-life instances of ‘change’ such as ‘premises destroyed by bomb’ and ‘hostile takeover bid’.

The second part of the book is a series of case studies in corporate policy initiatives – including the introduction of a comprehensive IT policy at Amnesty International; the management of change at the British Library; and information strategies in the National Health Service, plus organizations as diverse as an advertising agency, the University of North London, and the Surrey Police.

Of course there are no guarantees that conducting even the most searching and intelligent audit of knowledge is going to save an organization from political or commercial doom. One of the case studies discussed here is NatWest bank, currently being swallowed up by the Royal Bank of Scotland. But as Orna finally observes, when dealing with information systems and large-scale corporate developments, ‘a degree of detachment, and a sense of humour are…useful assets.’

It’s worth saying that this is also a beautifully designed and elegantly produced book. It belongs in that rare category of publications which for book-lovers are interesting to contemplate, irrespective of their content. It follows the modern practice – which has its attractions – of placing short lists of suggested reading after each chapter, rather than in one long bibliography at the end of the book.

This is one for information professionals. The message of Practical Information Policies is that successful ‘knowledge management’ depends on knowledge in human minds, expressed in effective action, fed with appropriate information, and supported by the right blend of IT and systems. It offers readers a straightforward way of working out what their organization needs to know to survive and prosper; what information it requires to ‘feed’ its knowledge base; and how people need to interact in using knowledge and information effectively.

© Roy Johnson 2000

Practical Information Policies   Buy the book at Amazon UK

Practical Information Policies   Buy the book at Amazon US


Elizabeth Orna, Practical Information Policies, Hampshire: Gower, second edition, 1999, pp.375, ISBN: 0566076934


More on information design
More on design
More on media
More on web design


Filed Under: Information Design Tagged With: Data management, Information design, Information policies, Research

Stop Stealing Sheep

July 19, 2009 by Roy Johnson

best-seller on the basics of typography and page design

Don’t worry about the quirky title. Just pay attention to what’s on offer. This is a popular beginner’s guide to the appreciation of type which teaches by good example. Every page is a mini-tutorial in good design – an elegant balance of body text, pull quotes, graphics, and a interesting variety of fonts, weights, and sizes. Spiekermann and Ginger start with the issue of appreciating and selecting typefaces for specific purposes. There are guidance notes on the provenance of the typefaces they discuss, and they take the line that context is all.

Stop Stealing SheepThat is, the value of a font can only be seen when it is put into use, and is seen where it will be used – on the page or screen. A lot of their exposition is conducted via extended metaphors – families, music, driving, and human character – which sometimes seem rather strained. But they do cover all the basics of typography: selection of font type, size, and weight; word and line spacing; and page design.

Make sure you get the second edition. It’s a big improvement on the first. Lots of colour has been added to the pages, and the topics they discuss now include the latest developments in font technology. They also explain how to choose type for the best effects on Web pages, email, and writing for the screen.

The emphasis is on visually exciting graphic examples, rather than a ponderous lecture on typography. That’s probably what has made this book such a best-seller. It’s an introduction which is entertaining and breathes enthusiasm for the subject of tasteful design. It’s also an elegant production in its own right.

© Roy Johnson 2002

stop stealing sheep Buy the book at Amazon UK

stop stealing sheep Buy the book at Amazon US


Erik Spiekermann & E.M. Ginger, Stop Stealing Sheep & find out how type works, Mountain View (CA) Adobe Press, 2nd edition 2002, pp.192, ISBN 0201703394


More on typography
More on technology
More on digital media


Filed Under: Typography Tagged With: Design, Fonts, Graphic design, Information design, Stop Stealing Sheep, Typography

The Elements of Typographic Style

May 31, 2009 by Roy Johnson

Best-selling classic manual – the typographist’s Bible

Subscribers to Internet lists dealing with fonts and typography often ask “Which books would you recommend as a guide to good design principles?”. And no matter how many responses emerge, one book comes out on top every time – Robert Bringhurst’s The Elements of Typographic Style. It’s a book packed with design wisdom. Bringhurst has produced what is essentially a first principles of typography – a grammar of good taste based on the relationship between form and content of printed matter.

The Elements of Typographic StyleIt’s also a very beautiful book in its own right. You will not fail to discover visual pleasures on almost every page, and the text is illustrated with such an astonishing variety of beautiful fonts, that this almost doubles as a catalogue of type designs. It is obvious from almost every word that he’s thought profoundly about the fundamental issues of printed words on the page, and he often has insights to offer on topics most of us take for granted. He can conjour poetry out of the smallest detail, and he offers a scholarly yet succinct etymology of almost every mark that can be made – from the humble hyphen to the nuances of serifs on Trajan Roman or a Carolingian Majuscule.

The well-made page is now what it was then: a window into history, language and the mind: a map of what is being said and a portrait of the voice that is silently speaking.

As you would expect, he traces the development of type from its origins in eleventh century China to the present, and he deals with such extremely subtle distinctions as the differences in quality of letter forms produced by pressing hot metal onto paper, by offset litho (laying the letter on top of the paper) or by the digital means of charged electrons on the screen. he doesn’t actually have much to say about computers and typography, and yet his brief comments summarise almost everything there is to say about digital type:

Good text faces for the screen are therefore as a rule faces with low contrast, a large torso, open counters, sturdy terminals, and slab serifs or no serifs at all. [And he might have added – ‘a large x-height’.]

He does seem to become a little fanciful when discussing the mathematics of page proportions, especially when maintaining an extended comparison with the musical scale, and he misses the chance to give historical examples of page design, rather than the mathematical tables which populate this part of the book. But it seems almost churlish to complain when everything is so beautifully presented.

He ends with two very useful chapters – one of which analyses commonly available fonts (“prowling the specimen books” as he calls it). Paragraph-length potted histories are followed by suggestions on how the font is best used. This is typical of the manner in which he very elegantly combines scholarship and a cultivated taste with the requirements of a practical guidance manual.

Bringhurst is also a novelist, and he brings a prose style of some distinction to the subject, ornamenting his text with the lyrical jargon of typography, and quite obviously relishing terms such at the pilcrow, the octothorpe, the virgule, guillemets and chevrons, and the solidus; as well as the romance of small caps, analphabetic symbols, the shape of pages, the order of footnote symbols, the ‘looser dressing’ and the ‘larger torso’ of a font.

The book ends with a fascinating tour of sorts and characters, revealing the subtle functions of the cedilla and the ogonek; the umlaut and the diaeresis; the ligatures aesc, and oethel; the prime, the macron, and the vinculum. He completes this tour de force with several more appendices: a glossary of typographic terms; a listing of type designers; another of typefoundries; a recapitulation of the main recommendations in the text; and a list of further reading.

This is a wonderful book which fully deserves its widespread reputation as a classic and the ultimate guide for laying out pages in print of on screen. Anyone who wishes to gain insights into the aesthetics and the finer details of good design should read this book. Anyone with a serious typographic intent should own it.

© Roy Johnson 2000

The Elements of Typographic Style   Buy the book at Amazon UK

The Elements of Typographic Style   Buy the book at Amazon US


Robert Bringhurst, The Elements of Typographic Style (2nd edn), Toronto: Hartley & Marks, 1996, pp.351, ISBN: 0881791326


More on typography
More on design
More on media
More on web design


Filed Under: Graphic design, Typography Tagged With: Fonts, Graphic design, Information design, Printing, Typographic style, Typography

The Elements of User Experience

June 19, 2009 by Roy Johnson

concise guide to navigational and usability theory

Usability has so far been dominated by the work of Jakob Nielsen – but now there are new voices emerging. John Lenker recently set out his ideas on what he calls ‘flowpaths’, and now here comes Jesse James Garrett with The Elements of User Experience, which is his pitch on the essence of navigational clarity in web design. First he argues the case for user-centred design. All sites must be organised to make it easy for visitors to find what they want. He has had a diagram on his web site for some time now illustrating the point.

The Elements of User Experience This book is an amplification of that basic concept. It’s an idea that the user experience is enacted at five levels. These correspond to the way in which a site is constructed: Surface – Skeletal – Structure – Scope – Strategy. They represent each part of our engagement in a web site – from the buttons we press, the way they are arranged, the design of pages, the links between them, and how all aspects of a site are co-ordinated to deliver its essential purpose. He is wise enough to realise that everything does not easily fit into such convenient categories, but he then explores each level in depth.

First comes the strategy document – a concise statement of the project’s objectives. He’s very keen on clarifying aims, drawing up specifications, and making content inventories. The idea of all this is to prevent ‘mission creep’.

Interestingly he doesn’t pad his argument out with lots of examples, but concentrates on explaining each level of his basic concepts in depth. He has an easy style, and he avoids jargon.

He’s very good on making subtle distinctions – between for instance information architecture and information design. And like many recent commentators, he argues the case for having multiple navigation systems. After all, why not give visitors to a site a variety of routes for getting from one place to another.

It’s at this point that the book becomes most interesting – when he looks at the details of information architecture and shows how they must be related to what appears on the page. There’s some excellent advice on using wireframes here for instance. These are the outline plans which show the underlying structure of a given page.

This is a clear and refreshingly concise account of planning, organising, and thinking through the design of a successful Web site. It’s a book which gives an overview of site-building concepts, and it will appeal to site designers as well as to project managers and usability consultants.

© Roy Johnson 2003

User Experience   Buy the book at Amazon UK

User Experience   Buy the book at Amazon US


Jesse James Garrett, The Elements of User Experience, Indianapolis (IN): New Riders, 2003, pp.189, ISBN: 0735712026


More on information design
More on design
More on media
More on web design

Filed Under: Information Design Tagged With: Information design, Navigation, Usability, Web design

The Renaissance Computer

July 16, 2009 by Roy Johnson

information architecture in early print technology

The Renaissance Computer is a collection of essays which seek to explore the similarities, connections, and lessons to be drawn from a comparison of the advent of digital technology with the age of print in the immediate post-Gutenberg period. In the 15th century the printing press was the ‘new technology’. The first ever information revolution began with the advent of the printed book, enabling Renaissance scholars to formulate new ways of organizing and disseminating knowledge.

The Renaissance ComputerThe basic argument is that the proliferation of printed texts was as revolutionary and presented similar problems of information architecture, storage, and retrieval as we feel we have now in our digital age. The earliest attempts at memory and storage systems were remarkably similar to the Windows operating system, though the fact that they were made physically manifest made them cumbersome and non-portable. Nevertheless, it would have been wonderful to visit Giulio Camillo’s memory theatre, where a visitor occupied the stage, and all the knowledge of mankind was stored on the tiered rows of what would normally be seats.

Editor Jonathan Sawday looks at precursors of the modern computer in the work of Milton, Hobbes, Pascal, Liebnitz, and Descartes. There’s a chapter on the role of illustrations in early modern books, another looks at the role of the index, title page, marginalia, and contents page as early examples of hypertext and navigation.

The authors also point to the amazing persistence of some outmoded technological forms:

Recent work on the circulation of manuscript collections of poetry in the seventeenth century…has demonstrated that this form of publication survived for two centuries after the invention of the printing press. The modern researcher who, seated in the rare book rooms of the Huntington Library or the British Library, laboriously copies out passages from an early printed book is participating in an ancient tradition.

There is a very interesting (and more readable) chapter on Thomas Heywood’s Gunaikeion (1624), an encyclopedia on women. The link with computers is no more than the suggestion that it’s a cut and paste composition, but the content sounds so interesting it made me feel I wanted to read a copy.

These chapters are scholarly academic conference papers – and the have both their strengths and weaknesses. Wide ranging and well informed, but often looking for connections where none exist or finding them to little purpose.

The idea of a Renaissance computer is only a catchy idea. These studies are of how information was organised in text form, how it was understood and retrieved, and how the Renaissance book tackled issues of information architecture which many people now think of as something new.

© Roy Johnson 2002

The Renaissance Computer   Buy the book at Amazon UK

The Renaissance Computer   Buy the book at Amazon US


Neil Rhodes and Jonathan Sawday (eds), The Renaissance Computer: knowledge technology in the first age of print, London: Routledge, 2000, pp.212, ISBN: 0415220645


More on information design
More on design
More on media
More on web design


Filed Under: Information Design, Literary Studies, Media Tagged With: Computers, Cultural history, Information architecture, Information design, The Renaissance Computer

The Visual Display of Information

July 20, 2009 by Roy Johnson

best-selling illustrated essays on presenting information

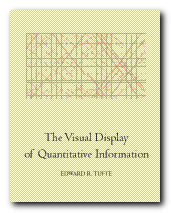
The Visual Display of Information is the earliest of the three books on information design which Edward Tufte has written, designed, and published himself. In it he develops his theory of “a language for discussing graphics and a practical theory of data graphics” The first chapter plots the rise of data maps, which he claims didn’t really develop properly until the late seventeenth century, and then took off in the nineteenth – from which he gives some very elegantly illustrated examples. The centrepiece of this section is Charles Joseph Minard’s time chart of Napoleon’s retreat from Moscow. This shows in a really interesting manner the devastating reduction in the size of the army plotted again geographic location and ambient temparature. It is a fascinating mixure of three levels of information rendered as a graphical image.

Graphical excellence is the well-designed presentation of interesting data – a matter of substance, of statistics, and of design.

The Visual Display of InformationI was surprised to find how his writing is even more compacted and elliptical than in a book such as Visual Explanations written nearly twenty years later. Here he writes of a map “achieving statistical graphicacy, even approaching the bivariate scatterplot”. You’ve got to be prepared to hack your way through a lot of this sort of thing.

In a discussion of the integrity of graphical data and statistics that lie he gives examples from Britain’s national debt during the war of American Independence – which show graphs going up whilst the truth goes down. This is very convincing – though I couldn’t easily get used to his habit of referring to ‘data’ in the plural.

He has the interesting notion that ‘data-ink’ ought to be minimised. In other words, any information will stand out more clearly the less printing is done to present it.: “The number of information-carrying dimensions depicted should not exceed the number of dimensions in the data”. You’ve got to be prepared to leap from traffic deaths and government expenditure to the properties of chemical elements, and be prepared for lots of detail on the difference between boxplots, bar charts, histograms, and scatterplots.

He’s basically in favour of simplifying representation – reducing what he calls ‘chart-junk’. That is, anything which does not contribute to revealing information. Yet there remain strange contradictions. One of his edicts (which seems sensible) is that “Graphics can be shrunk way down – Many data graphics can be reduced in area to half their currently published size with virtually no loss in legibility and information.” Yet he often presents examples of bad (but visually attractive) graphics across double page spreads. And he’s not bashful. When it comes to naming one of his own designs (a list of voting patterns in the 1980 US elections) it becomes not a mere list but a ‘SUPERtable’.

But this is a stimulating and attractive production. I was surprised that there wasn’t a formal bibliography, but he chooses to foreground his references directly into the generous page margins as a design feature. He developed a graphic style for this book which he has stuck to ever since. The basic formula is beautiful illustrations, some occupying a whole page, with the relevant text condensed in a crisp and economic style. No topic exceeds a double page spread, and the book is produced from very high quality paper, printed like a work of art, and bound as if it were a rare first edition.

© Roy Johnson 2002

The Visual Display of Information   Buy the book at Amazon UK

The Visual Display of Information   Buy the book at Amazon US


Edward Tufte, The Visual Display of Quantitative Information, Cheshire, CT: Graphics Press, 1997, pp.156, ISBN: 0961392126


More on information design
More on technology
More on digital media


Filed Under: Graphic design, Information Design Tagged With: Displaying information, Edward Tufte, Graphic design, Information design, The Visual Display of Information

Tools for Complex Projects

July 16, 2009 by Roy Johnson

large scale project management skills

Tools for Complex Projects is not just about project management – but the management of complex and large scale projects. That complexity might be structural (building a large engineering plant) technical (developing a major new chemical) directional (a cross-national political initiative) or temporal (national oil supply during a time of war). The overall strategy of Kaye Remington and Julien Pollack’s approach to this subject is to examine the nature of these complex projects in some theoretical detail and then to offer a series of practical tools for dealing with them. There are of course other ways of categorising complexity – most commonly by scale or cost of a project, its duration, or the degree of risk to its owners. Their claim is that the four categories they have chosen are more fundamental and will cover any project.

Tools for Complex ProjectsIt has to be said that the theoretical part of the book is extraordinarily dry reading:

During implementation, variance control must be vigilant so that stakeholders are kept informed of possible cost blow-outs. Techniques like Earned Value Management (EVM) a tool which links scope with time and cost, can be used to translate schedule slippages into budgetary terms.

Discussing the features of large and complex projects only really comes to life when concrete examples are used to illustrate the argument. It’s only when a chemical refinery, an ocean-going oil tanker, or the production of a full-length feature film hove into view that the picture snaps into focus.

The same questions are posed in each of these cases. What are the implications for communication and control within the project? What does the project manager need to do to in terms of team support, finance, scheduling procurement, and risk analysis?

In fact the larger the project, the more likely it is that these issues will be delegated to individual experts. The project manager however must have the skills to keep the larger picture and the smaller details in mind at the same time. S/he must have the capacity to be one moment an eagle, and the next a mouse.

The second part of the book looks at a number of ‘tools’ for dealing with the problems generated by complex projects. These in general are suggestions for defining the problems that arise using charts and ratings boxes; drawing up one-page ‘maps’ which show the ‘anatomy’ or connections in a complex system; and collaborative working arrangements (CWAs) instead of adversarial lump-sum contracts in the construction industry to reduce budget over-runs.

Some are fairly obvious such as splitting a large-scale complex problem down into a series of smaller discrete projects which are easier to manage and complete. Another is defining quite carefully the roles and responsibilities of project team members.

Multiple tools may be employed where uncertainties are created in long term projects (due to political or environmental changes, or financial problems arising out of volatile stock-markets. In such cases, a cost review might take precedence over an examination of delivery dates.

Risk-assessment maps can be drawn up to calculate the possible effects of worst-case scenarios. These look something like TV weather forecasts, where the arrows get bigger and are packed together more tightly – to show where the danger lies and where an emergency procedure needs to be put in place.

It occurred to me whilst reading this book that one of the largest and most complex projects I could think of was governing a country. I wonder if Gordon Brown or George Bush use any such management tools whilst simultaneously running democracies and waging costly wars – which we pay for. Somehow I doubt it, but maybe they should.

© Roy Johnson 2007

Tools for Complex Projects   Buy the book at Amazon UK

Tools for Complex Projects   Buy the book at Amazon US


Kaye Remington and Julien Pollack, Tools for Complex Projects, London: Gower, 2007, pp.211, ISBN: 0566087413


More on design
More on media
More on web design
More on information design


Filed Under: Product design Tagged With: Information design, Project management, Tools for Complex Projects

Visual Explanations

July 20, 2009 by Roy Johnson

best-selling illustrated essays on presenting information

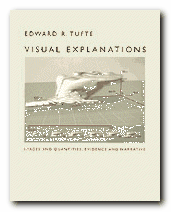
Visual Explanations is Edward Tufte’s passionate manifesto for intelligent information design. He is concerned with the need for scale, accuracy, and truthful proportion in the visualisation of data. The book derives much of its charm from the beautiful reproduction of its illustrative materials. He includes engravings, photographs, maps, computer-generated images, and even built-in flaps showing motion and before-after effects. The diversity of his examples is just as impressive.

Clarity and excellence in thinking is very much like clarity and excellence in the display of data. When principles of design replicate principles of thought, the act of arranging information becomes an act of insight.

Visual ExplanationsThey are drawn from scientific papers, conjurors’ manuals, and even books designed to be read under water. In one stunning example, he uses video snapshots of his own two-dimensional yet dynamic visualisation of a thunderstorm. Tufte [pronounced “TUFF-tee”] makes his central argument in a chapter which has now become famous.

This discusses the mis-representation of data related to the 1986 Challenger space shuttle which resulted in a disastrous explosion and the death of all the cosmonauts on board. His dense technical analysis of data-presentation and bad practice is used to argue that the fatal accident could have been averted if charts and diagrams had been presented more intelligently, more accurately.

A chapter on conjuring tricks focuses on the clever representation of temporal progression in single illustrations from how-to-do-it books. However, it has to be said that sometimes it’s not quite clear what point he’s making, and he seems to be struggling with what is obvious: that it’s difficult to represent fluid motion in static, two-dimensional images.

Eventually it emerges that he wishes to compare magic with it’s opposite – teaching. One amazes by concealment, the other should inform by revelation. “Your audience should know beforehand what you’re going to do.” That’s a useful insight for some of us.

His attitude is enormously confident and persuasive. Yet if you can brace yourself as a reader, it sometimes seems that he doesn’t always follow his own theories in the presentation of materials – and this in a book which he wrote, designed, and published himself. On some pages, it’s difficult to link illustration to argument; some reproductions are disproportionately large for the point they are making; and he pursues the odd habit of crowding the generous page margins with bibliographic minutiae which would normally be reserved for chapter endnotes.

He writes in a cryptic, elliptical manner, and is much given to compressed generalisations and gnomic claims such as “to make verbs visible, is at the heart of information design” – though this approach can also be quite witty, as when he dismisses one of the bad examples as “better than nothing ([but] that’s all it’s better than”.

Despite these occasional oddities, there are thought-provoking ideas on almost every page. For instance, the idea that the public health warnings on US billboard cigarette advertisements are less effective because they are difficult to read, crammed as they are into boxed text, sans-serif fonts, in continuous capitals, and underlined – which makes four typographical solecisms in one.

SURGEON GENERAL’S WARNING: SMOKING CAUSES LUNG CANCER, HEART DISEASE, EMPHYSEMA, AND MAY COMPLICATE PREGNANCY.

Despite the graphic variety of his presentations, many of his arguments are amazingly orchestrated onto single or double-page spreads, and the book is an almost irresistibly beautiful production. What he’s actually talking about is visual rhetoric: “by establishing a structure of rhythm and relationships, [graphic] parallelism becomes the poetry of visual information”. We might wish to query some of his theoretical claims, but it’s very hard to be critically detached from such a seductive presentation of evidence – which paradoxically is the very point he’s warning us about.

© Roy Johnson 2002

Visual Explanations   Buy the book at Amazon UK

Visual Explanations   Buy the book at Amazon US


Edward Tufte, Visual Explanations, Cheshire, CT: Graphics Press, 1997, pp.156, ISBN: 0961392126


More on information design
More on technology
More on digital media


Filed Under: Graphic design, Information Design Tagged With: Displaying information, Edward Tufte, Graphic design, Information design

  • « Previous Page
  • 1
  • 2
  • 3
  • 4
  • 5
  • Next Page »

Get in touch

info@mantex.co.uk

Content © Mantex 2016
  • About Us
  • Advertising
  • Clients
  • Contact
  • FAQ
  • Links
  • Services
  • Reviews
  • Sitemap
  • T & C’s
  • Testimonials
  • Privacy

Copyright © 2025 · Mantex

Copyright © 2025 · News Pro Theme on Genesis Framework · WordPress · Log in